The first week of the Paris Climate Talks started five days ago, on Monday. As the talks opened, Laurent Fabius, French Foreign Minister, reminded delegates:
“The eyes of the world are upon us.”
Others echoed this theme:
“I have my #eyesonParis.” Naomi Klein tweeted
“Let there be no doubt. The next generation is watching what we do”. President Obama declared.
“The eyes of millions of people are on you not just figuratively, but literally.” Christiana Figueres, Head of UNFCCC, proclaimed.
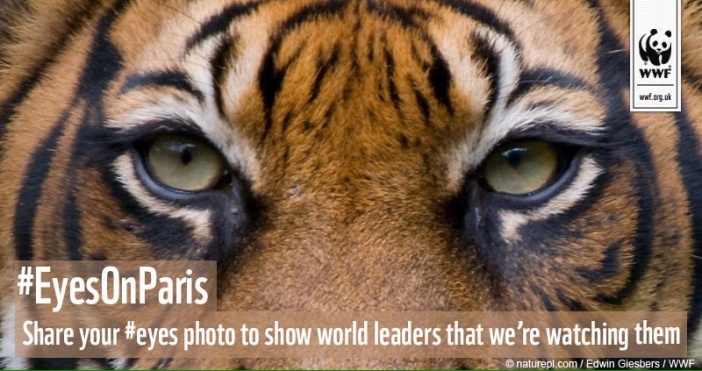
Have you seen the #EyesonParis trend, launched on Twitter, with people posting eye selfies to show that they are watching the progress of the negotiations?
For the photo challenge, I edited a picture of my eyes, taken while I was trying on glasses in January. Trust me, I tried to take a selfie today, but lack of skill and photogenicity (my word) led to dismal results.
And then there was the #Zero by 2050 action organized by SustainUS and youth delegates. The campaign is for zero carbon emissions by 2050 to keep global warming below 2ºC. I heard about it through the Canadian Youth Delegation. They posted the following photo on Twitter showing their symbolic action: painting a large zero around one of their eyes:
We envision a world transformed by an awareness of the true potential of every human being, where all of life is sacred and where all our social systems work in harmony with the earth. We see a world in which conflict rarely occurs, and when it does, can always be addressed by the creative energy of nonviolence. In this world, unarmed peacekeeping has replaced military intervention, restorative justice has replaced retribution, and needs-based economies have replaced consumerism, among other essential changes.
Recently I have been browsing the words of peace activists. It’s as if I’ve been awakened from a slumber. I care about many issues, but like most people cannot possibly absorb and read about everything. In the last five years I’ve chosen the environment as my main area of focus, simply because I see our planet as a home base, needing to be protected from the effects of human pollution.
I have always been in favour of World Peace. Who isn’t? The question though is: ‘How do we achieve it—through weapons and force, or through more subtle means?’ A non-violent approach would be to consider reasons underlying human conflict. Hungry, sick, abused people don’t get along, and they are vulnerable to those with weapons, seeking power. Poverty, lack of clean water, unemployment, social injustices, illiteracy, and so on undermine a peaceful world.
Climate change researchers have been saying for years that climate stressors, such as drought, flooding, high temperatures, torrential storms, etc. will promote social and political instability. This is exactly what happened in Syria. It is difficult for historians to pinpoint precise causes, but they do identify factors, and a factor that clearly contributed to the conflict in Syria today is the severe drought that region suffered from 2006 to 2010. There were major crop failures, sky-rocketing food prices, and massive migration from rural to urban areas.
The international climate talks known as ‘COP 21’, will be held in Paris from November 30 to December 11, despite heightened security concerns. The ‘show’ must go on and world leaders know this. Recent acts of terror and the Syrian refugee crisis only emphasize the urgency of promoting global peace and stability.
The climate talks are about binding commitments to reduce carbon emissions. Action is needed to prevent an irreversible tipping point, when devastating climate changes will render some locations uninhabitable. The talks are also about providing assistance to developing nations: for sustainable development with clean renewable technologies; and for climate change adaptation. All of these issues must be attended to—to gain and preserve peace.
There is only one thing that makes a dream impossible to achieve: the fear of failure.
Paul Coelho, The Alchemist
…
It always seems impossible until it’s done.
Nelson Mandela
…
Inspiring words–I discovered the first quote, while researching Christiana Figueres, leader of the United Nations climate change negotiations between world governments. A New Yorker journalist noticed that Ms. Figueres has a framed saying behind her desk that reads: “Impossible is not a fact, it is an attitude.” A fitting motto for someone who is passionate about fighting climate change, and whose role includes leading a team of 500 United Nations employees and hosting annual climate change conferences.
Christiana Figueres speaking at press conference at the Bonn Climate Change Conference, 2012
Christiana Figueres’ vision is clear: the world must find a way to decouple economic growth from carbon emissions. In other words, she is not assuming that the world will be persuaded to stop growing–especially not an option for countries in poverty that need to develop. Her vision for the future is ongoing growth, while employing energy efficiency and clean energy, rather than fossil fuels.
While Figueres is quite aware of the obstacles and the urgency of addressing climate change, she leads with positivity, patience, and understanding. In a recent Union of Concerned Scientists Webinar, she said that economic “self-interest is becoming a key driving force on all levels”, as are scientific and moral imperatives. Society as a whole, not just governments, have an important role. The climate actions of political leaders are being driven increasingly by businesses, scientists, faith leaders, and concerned citizens.
How do I relate to the ‘impossible’? I have been wondering lately if I have a dream or whether I avoid a defined vision so as to avoid failure. Those who have been scanning my blog will know that I am quite concerned about climate change, and while I do what I can personally, I get discouraged by the disconnect between where society appears to be going and the information provided by science. Nevertheless, positive changes are happening–so my current mission is to know more about them and to share through my blog and Twitter. Besides that, I want to express myself and be heard, which means persisting with developing a blog that many people read. I find all three of the quotes cited above personally inspiring. Please read on for even more inspiration from Christiana Figueres.
The ultimate discovery, on my Christiana Figueres ‘investigation’ was a Commencement Speech that she made at the University of California. In this talk she offered two guidelines for life’s journey distilled from her personal experiences. They demonstrate her profound sense of purpose and vision, determination, optimism, and patience:
Create Your Own Reality:
Decide to consciously exercise the power to create your own reality. The quality of your life is not determined as much by what happens to you but rather by how you react to what happens.
…
Go with the determination to create the reality you want for yourselves, for your society and for your century.
Let the Full Plan Unfold Gradually:
Discover the joy in every individual experience in your life, and have the patience to let the full plan unfold gradually.
…
It is not about getting to the ultimate perfect destination right away, it is more about fully appreciating each stop along the way, and knowing that each stop has a lesson to be learned, a skill to be honed. Eventually you will be able to connect the dots, even if those connections are not evident from the start.
This post is being linked to Writer’s Quote Wednesday September 23hosted by Colleen Chesebro, author of SilverThreading. Please follow the above link to read the launch post. As well, there are links to other Writer’s Quote Wednesday posts in the Comments section.
Today I would like to feature the City of Paris, host of the upcoming international climate summit, and share a Paris video. Theinternational climate change talks at the end of this year are extremely important.In every countrywe need national leadership to transition from a fossil fuel based society to a conserving, renewable, clean energy world. In some countries, more than others, focussed leadership is lacking. Everywhere there are citizens, businesses, non-profits, cities, towns, provinces, states, and so on taking steps to reduce carbon emissions. However, national leadership is still essential, to keep on top of goals and achievements and to create a consistent framework. In my country, Canada, we have had poor environmental leadership from our federal government. Once there is a strong international agreement to reduce carbon emissions, this will have to change.
France has an important diplomatic role as host of the 21st meeting of the parties to the 1992 UN Framework Convention on Climate Change. France’s role goes far beyond providing facilities for thousands of delegates, visitors, and journalists who will descend on Paris in late November of this year. As host of the talks, France is the official facilitator of negotiations, organizing preparatory meetings throughout 2015, and steering the December talks towards a binding agreement.
If successful, the world will emerge from the 2015 Paris talks with the first ever binding global agreement to achieve specific carbon reduction targets. The process has taken over 20 years–let’s hope that we, the global community, are successful in arriving at a fair, ambitious agreement.
Why is France hosting these talks? Why France? Why not France? The answer is that world nations are divided into 5 UN regions: Asia-Pacific; Eastern Europe; Latin America and the Caribbean; Western Europe and Others; and Africa. The facilitator role for the climate summits rotates from region to region. For 2015 it was up to the Western Europe and Others Region to select a host. In 2012 France’s President François Hollande announced his nation’s interest in taking on the task; the designation became official in 2013.
Under the Spotlight. Of course the host of an international conference on climate change will ideally set a good example, demonstrating good practices in sustainability, conservation, and low carbon emissions in running the event. Paris has some very interesting innovative projects on the go. I hope you enjoy this Paris video showing urban sustainability solutions in practice–you’ll probably recognize some of the initiatives also occurring in your community.
The flow of the video is quick, but that can be better than slow. Here are a few of the initiatives that are mentioned:
City climate plan with goals for reducing carbon emissions and increasing use of renewable/recovered energy by 2020
Transportation sharing through bike and car rentals
Cycle paths
Circular economy promoting recycling and composting
Pneumatic waste collection (I haven’t seen that one before)
Green walls and rooftops
Geothermal heating; Solar panels
Renovating for energy efficiency
Planting trees and creating green spaces
Local food markets.
What’s going on in your community? Is there a “green” initiative that you are particularly happy about?
French Amer-Can Climate Talks (FACTS):“FACTS aims to mobilize French, American, and Canadian public opinion on the issues of the conference and reinforce the dialogue between experts from these countries. FACTS is a public conference series planned to take place in seven cities in the United States and Canada involving renowned scientists, civil society representatives, NGOs, political figures, journalists and entrepreneurs”.
As of today, August 17, there are 100 days to the International Climate Summit in Paris, to be held from November 30 to December 11, 2015. Did you know that they expect roughly 40,000 people to attend the summit at Paris-Le Bourget—20,000 of whom will be officially registered? I had no idea until today. For those who are not in the halls of negotiation, there will be displays, and events such as debates, talks, and screenings. There is an official website for COP21, which includes a wide range of information, such as a webzine with quick fact sheets, information for those planning to attend, a calendar of diplomatic events leading up to the summit, news releases, and more.
ACRONYM OF THE DAY: COP21-UNFCCC
21st Conference of Parties to the United Nations Framework Convention on Climate Change
OCEONIA, courtesy of the University of Texas Libraries, The University of Texas, Austin
OCEANIA:Courtesy of University of Texas Libraries,University of Texas, Austin.
The other day, enthused by my experiments with global warming themed haiku, I looked for other poetry on the topic and discovered many environmental poets. One author who writes about climate change, as well as other topics, is Kathy Jetnil-Kijiner, an accomplished Marshallese poet, writer, spoken word artist, journalist, WordPress blogger, college teacher, and mother. As I looked into her work, two separate but connected stories emerged that I decided to feature as part of this “Road to Paris 2015” blog post: Kathy Jetnil-Kijiner’s spoken word performances of climate change poems and the courageous climate change strategy of her homeland, the Republic of the Marshall Islands.
The Republic of the Marshall Islands, in the North Pacific, along with other Pacific Island nations, is in a particularly vulnerable position. With rising seas and tropical storms unleashed by the global warming process, it has already experienced flooding and damaging winds. If sea levels continue to rise, their homes could be engulfed and destroyed. The Marshall Islands consists of over 1100 islands spread over 24 coral atolls as depicted by the orange dots in the map below. For those, such as myself, who are unfamiliar with ocean geology, a coral atoll is a ring-shaped coral reef encircling, a lagoon–reefs can be submerged or above water as islands or islets.
A closer look at the Marshall Islands, spread over 24 coral atolls, with the capital residing on Majuro. Section of larger Oceania map courtesy of the University of Texas Libraries, The University of Texas at Austin.
A closer look at the Marshall Islands, spread over 24 coral atolls, with the capital residing on Majuro. (Section of larger Oceania map courtesy of the University of Texas Libraries, The University of Texas at Austin.)
As a developing nation that produces less than .00001% of global greenhouse gas (GHG) emissions, the Marshall Islands might be expected to focus on pressuring major GHG emitters to clean up their act or on shoring up their own defences. However, this is not this nation’s approach. Citing the Marshall Islands moto: “Accomplishment through joint effort” (English translation) they have chosen to take part “in the global effort to combat climate change, demonstrating that even with its limited means it will undertake the most ambitious action possible”. They expressed this intention in their Intended Nationally Determined Contribution (INDC) document submitted to the UNFCCC, the UN climate treaty organization–a document which outlines their commitment and strategy for reducing GHG emissions. All nations participating in the UN climate talks have been asked to submit an INDC as soon as possible prior to the December talks. To date, only 47 out of 196 participants have done so.
The Marshall Islands INDC plan is ambitious: They will reduce GHG emissions to 32% below 2010 levels by 2025 and by 2050, or earlier, they will achieve net zero emissions. Their key strategies include energy efficiency and ongoing uptake of renewable energies–particularly solar energy, biofuels and ocean thermal energy conversion. Given the vulnerablility of their location (in the middle of the Pacific Ocean) and their limited resources, this nation could have chosen to focus entirely on adaptation and survival, but instead, they are standing as world citizens, pledging to do the best they can to eliminate their contribution to human-induced global warming.
The Second Story: Kathy Jetnil-Kijiner, a Marshallese writer, whose work has often highlighted social, political, and environmental issues, received global attention in September 2014 when she was selected from hundreds of applicants to participate in the opening of the UN Climate Summit in New York. At this event she performed “Dear Matafele Peinam”, a poem dedicated to her daughter promising that she will not stand by and let the ocean take their home. There are a few videos of her performance of this poem, but I have chosen this one as it includes her introductory speech at the UN Summit:
In June of this year Kathy Jetnil-Kijiner posted another climate change poem called “Two Degrees“. In this piece she talks about why we should aim to keep global temperatures from rising less than 1.5 degrees C above pre-industrial levels, rather than less than 2 degrees C above pre-industrial levels. The 2 degree warming limit may prevent some disasters, but there is no assurance that it will be sufficient to prevent ocean flooding and storms that are sure to devastate Pacific island and coastal nations. Indeed, I would expect that coastal peoples worldwide would prefer the more conservative target. You can read the text of the Two Degree poem on her blog and take a look at the CNN video of her spoken word performance. Or perhaps you would just like to visit Kathy Jetnil-Kijiner’s blog to browse her posts. Her blog is called: IEP JELTOK, a basket of poetry and writing, as explained on her “About” page“.
For a previous post, I composed two “Free Market” haiku poems in response to Ronovan’s Weekly Haiku Challenge #53. The two prompt words were “guide” and “mad”.
driven by profit
with no brakes
wild weather
…
My source of inspiration: This Changes Everything, by Naomi Klein.